

Mark Monroe is Chief Technology Officer and VP of DLB Associates. He recently served as Executive Director of The Green Grid, an IT industry and end user consortium focused on resource efficient data centers and business computing environments.
Think back to a few weeks ago, when March Madness was gripping the U.S. with basketball playoff fever. The ultimate measure of basketball productivity--total points--was carefully measured and tallied, using transparent, standard methods and highly objective reviews of whether a production event (a “shot”) resulted in 0, 1, 2 or 3 points. No one argued about how to measure total productivity one had to measure how many times and how fast the teams moved the basketball up and down the court, or how many basketballs were stored on the racks behind each teams’ benches, not being used, but ready in case anyone needed quick access to them.
The teams totals were objectively compared on a public display (the scoreboard) using a simple standard that had been established 123 years ago. The team that was most productive in the time allotted is allowed to continue, while the less productive team has to go out of business.
This way of looking at the basketball competition puts it in terms similar to the business world, where companies must compete, mostly with less objective, less transparent, and less standard methods of measuring performance than sporting events.
Wouldn’t it be great if there was something as simple for the information technology industry: counting the number of times something happened, adding it up on a scoreboard, then having everyone be able to understand what had happened, what should be done to improve. And, that the measurement was able to do what everyone really wants to do, compare themselves to their competition to see who “won.”
Data Center energy Productivity (DCeP) Gets The Nod
The Green Grid released a memo from their Global Harmonization Taskforce (GHT) 1 in the middle of March, describing new agreements that the team of global experts had reached over the last 18 months of discussion and negotiation. (Side note: I am very familiar with the people and working of the Global Harmonization Taskforce: I was on the board of directors of The Green Grid for 5 years, and was Executive Director of the organization Jan 2011-Aug 2012. I attended GHT meetings and applaud their efforts to come to agreement on many aspects of data center metrics from Power Usage Effectiveness (PUE) to Green Energy Coefficient (GEC). It’s a venerable group and does great work.)
One of the metrics endorsed in the GHT memo of March 14, 2014 is Data Center energy Productivity, abbreviated DCeP.
DCeP was first described 6 years ago in The Green Grid’s publication, WP#13-A Framework for Data Center Energy Productivity, released in April 2008.2 The original paper, and the Mar 2014 memo, describes DCeP as a metric that “quantifies the amount of useful work a data center produces relative to the amount of energy it consumes.”
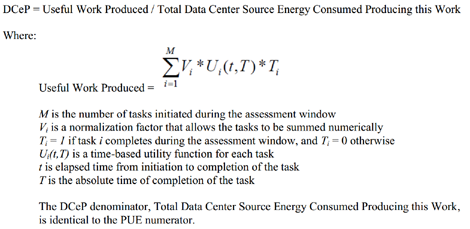
The paper and memo describe a complicated equation that takes into account the relative value of transactions, the time-based decay of that value, and a normalization factor for the transactions. These last three parameters are set arbitrarily based on each business’ understanding of their IT operations. A business can pick any measure of utility and value for any transaction in their IT infrastructure, and use that to develop a picture of their DCeP value that applies to their business.
Peter Judge, a London-based IT journalist and consultant, wrote a great piece in Techweek Europe 3 in response to the announcement. In it, Peter wonders if YouTube would be measuring productivity in terms of “Kitten videos per kWh,” which some interpretations of DCeP would lead you to agree. I’d even go so far as to say "Kittens per kWh" might be the right measure of productivity for YouTube!
The Necessity of Simplicity
Despite the constant flailing that PUE takes from critics, it is the most used, most effective efficiency metric in the IT industry today. Other contenders from CADE to FVER have not gained the coverage, reporting, or public improvement that PUE has.

From the first study by LBNL in 2007 to Facebook’s and eBay’s real time, online meters, there has been real change in the industry because of the use of this measure. Since the first reports by Lawrence Berkeley National Labs in 2008 to the real-time Facebook display, reliably reported PUE has dropped from an average of 2.2 to 1.08, a 93 percent reduction in wasted energy.
I believe one of the biggest reasons for that success has been the simplicity of PUE: hire an intern, send them around the data center with a clipboard, in a couple hours you have an estimated PUE value that a C-level executive can grasp in an instant. One number divided by another, up is bad, down is good, it cost less than $100 to collect your first value. Any metric that requires more from the user is bound to fail wide adoption.
This is the fundamental problem with DCeP. It’s complicated.
Sigma Later, Alligator
First, any equation with a Greek sigma (Σ) in it loses about 80 percent of its potential users. Though it is necessary for the mathematical description of the metric, all those people who hated algebra in the 7th grade will balk at learning the use of this equation.
Second, because the equation contains arbitrary value constants and functions, it cannot be used to compare one company to another. The Green Grid makes it clear this is not the primary purpose of the metric, but that is what users want the most: to be able to compare their performance against others in their industry, their geography, their business, to see if they are a leader or laggard in providing IT services. The mantra of, “this metric can be used for measuring improvements over time within an organization” doesn’t help; almost everyone who measures performance wants to compare their number with someone else’s.
Third, even if my organization can put up with the complexity of the math, this will take a long time to implement, collect, manipulate, report, and explain. If one is measuring total data center productivity, and there are 300 applications running in the data center, I have to instrument all 300 apps to collect their transactions, send all the data to a central collection point, process data based on the arbitrary value and utility functions, calculate the time function, sum the normalized transactions over the reporting period, and then figure out how to describe this process and the results to the execs.
No intern with a clipboard here--collecting and processing this info will require significant programming resources, cost, and time.
A DCMM-based Alternative
The Green Grid has been working on their Data Center Maturity Model (DCMM) for a number of years now. Like other maturity models, it provides a road map to improve capabilities in many areas of operations. The Green Grid’s DCMM has 5 levels, spanning the range from “no effort” to “current best practice,” and extending on to “visionary practice: 5 years out” in 46 topic areas dealing with IT and Facilities.
The chart below shows a suggested change to the DCMM, and a spectrum of performance measurement that can guide organizations from making no estimate of their IT productivity to having a business-based, meaningful measure that can not only tell how much work is being performed by the IT equipment, but can predict what is the maximum capacity of the IT infrastructure.
 Click to enlarge.
By starting with a simple aggregation of raw CPU utilization of some machines in the data center, the company can get an idea of how much resource is being used. By “raw” utilization, I mean at first assume that all machines are equal and a percent of utilization on one machine is the same on another machine. There are plenty of flaws with this plan, but let’s look at the positives:
- The number can be obtained quickly, at low cost, and unobtrusively in a production environment (back to the intern with the clipboard)
- Utilization in Level 1 is a percentage, so unit-less. Easy to understand for CxO
- Using an industry-standard benchmark, like SPECint_rate 2006, converts into work units (SPEC operations)
- An average utilization figure, and an uncertainty band, can be calculated
- Total capacity of the IT equipment can be calculated (answer to “how much do we have?”)
- More analysis can be done by adding adjustments for CPU clock speed and architecture differences
- Can easily be moved to counting transactions of key business-critical systems
As an organization matures in its measurement of productivity, more and more sophisticated methods can be used. Accounting for differences between processors, beginning to count critical transactions, developing business-oriented Key Performance Indicators that point out the relationship between IT transactions and revenue or costs are all ways to enhance the performance assessment.
ACK-poo! Comparing to Others
Plenty of flaws, yes, but they don’t outweigh the positives of having simple utilization and capacity numbers. Up through Level 2, where industry standard benchmarks are used to convert utilization into operations completed, organizations could begin to compare themselves to others (with the same caveats as early PUE comparisons).
To me, the best thing that could happen is a bunch of people could start calculating and publishing Aggregated Average CPU Utilization (AACPUU, or ACK-poo!? Bleah. Needs a new acronym). Then analysts can pick it apart, telling why it’s so wrong, how it can be gamed. Then everyone will secretly calculate their value and say “Phew” or “Oh My Goodness!” when they find out how good or bad they are compared to others. Then real change will happen.
A simple metric like aggregated CPU utilization will show organizations how much capacity they have and how much they are using it. I urge everyone to send an intern into the data center, collect the data on 1000 machines this summer, and see how valuable it is. Make real change in your organization, let the experts argue amongst themselves.
Endnotes:
1The Green Grid, "Global Leaders from Industry and Government Reach Agreement for Measuring Data Center Energy Productivity." Mar 14, 2014.
2Dave, Anderson, et al. The Green Grid, "A Framework for Data Center Energy Productivity." Apr 2008.
3Judge, Peter. TechWeek Europe, "Data Centre Productivity Will Be Measured In Kittens Per KWh." Mar 26, 2014.
Suggested DCMM table is not approved by or associated with The Green Grid.
Industry Perspectives is a content channel at Data Center Knowledge highlighting thought leadership in the data center arena. See our guidelines and submission process for information on participating. View previously published Industry Perspectives in our Knowledge Library.


