Insights From Forrester’s US Retail Recovery Heat Map, January 2021
Over the last 10 months, we have estimated how the retail economies of 30 major US metropolitan areas are recovering from COVID-19. By aggregating 11 metrics (across retail sales, local economic indicators, and virus spread), our model predicts that these metropolitan areas will face differing levels of COVID-19 disruption. For these metrics, we looked at US metropolitan-, county-, and state-level data on:
- Prior dependency on retail. We looked at retail sales per capita, retail sector employment per capita, and estimated retail GDP.
- Severity of the COVID-19 outbreak. We looked at the size of outbreak per capita, per capita deaths due to COVID-19, how fast cases are increasing, and the number of new unemployment filings.
- Remediation efforts. We looked at estimated social distancing data, foot traffic in retail locations by state, and how proactive the stay-at-home orders were in each city.
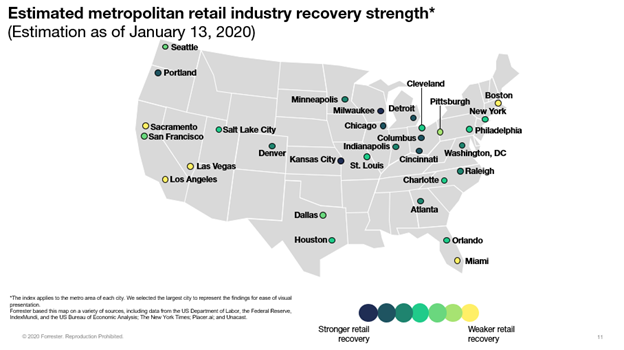
Over the last months, we have seen some variation on the list of metro areas that exhibited the strongest retail recovery and those displaying the weakest. Metro areas that have seen weaker retail recovery (“yellow” on the chart below) for several months include Miami, Las Vegas, and Los Angeles — primarily due to continued high levels of cases and a retail economy dependent on tourism and entertainment, which have taken a hard hit.
This month, Boston and Sacramento are also in the “yellow” zone. Both metro areas have high growth of cases and high per capita levels of daily infection, as well as decreased retail foot traffic.
If you would like to see the data behind these metrics or see more metropolitan areas, please contact your Forrester account representative, schedule an inquiry with me, or email Madeline Cyr, researcher, at mcyr@forrester.com.
Categories