Learn how to Use Windows Performance Recorder in Windows 11. Windows Performance Recorder (WPR) is a performance recording tool based on Event Tracing for Windows (ETW). It records system and application events that you can then analyze using Windows Performance Analyzer (WPA).
You can use WPR together with Windows Performance Analyzer (WPA) to investigate particular areas of performance and gain an overall understanding of resource consumption. WPR and WPA enable development and IT professionals to proactively identify and resolve performance issues. WPR requires Windows 8 or later.
There are two types of WPR: User Interface (WPRUI.exe) and Command Line Interface (WPR.exe). They share the same .dll, but not all the features are accessible through WPRUI. WPR.exe ships with Windows OS (Windows 8.1 or later), and you do not need additional installation.
The WPR user interface (UI) makes it simple to generate a recording by using built-in recording profiles to analyze CPU usage, power issues, poor system or application performance, or other performance issues.
Windows Performance Recorder (WPR) continues to support command-line recordings created using Xperf.exe and Xbootmgr.exe. However, Xperfview is no longer supported. Windows Performance Analyzer (WPA) can open recordings created using Xperf, Xbootmgr, or WPR or recordings created by the Assessment Platform.

- Microsoft Ends Support for Running Android Apps on Windows 11
- Get Windows Restart Frequency Insights from Intune Endpoint Analytics
Download and Install Windows Performance Recorder
Windows Performance Recorder (WPR) is included in the Windows Assessment and Deployment Kit (Windows ADK), along with other performance tools such as Windows Performance Analyzer and Xperf. You can download WPR by visiting Windows Assessment and Deployment Kit (Windows ADK).
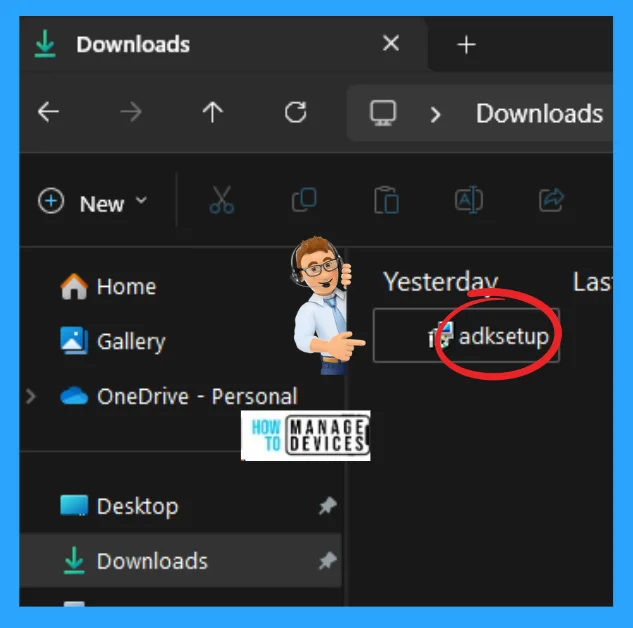
By clicking the above link, the Windows ADK starts downloading and saving in your device’s default downloads folder or the download place selected by the user. Find the setup file and double-click on it to start the installation process, as shown in the image below.
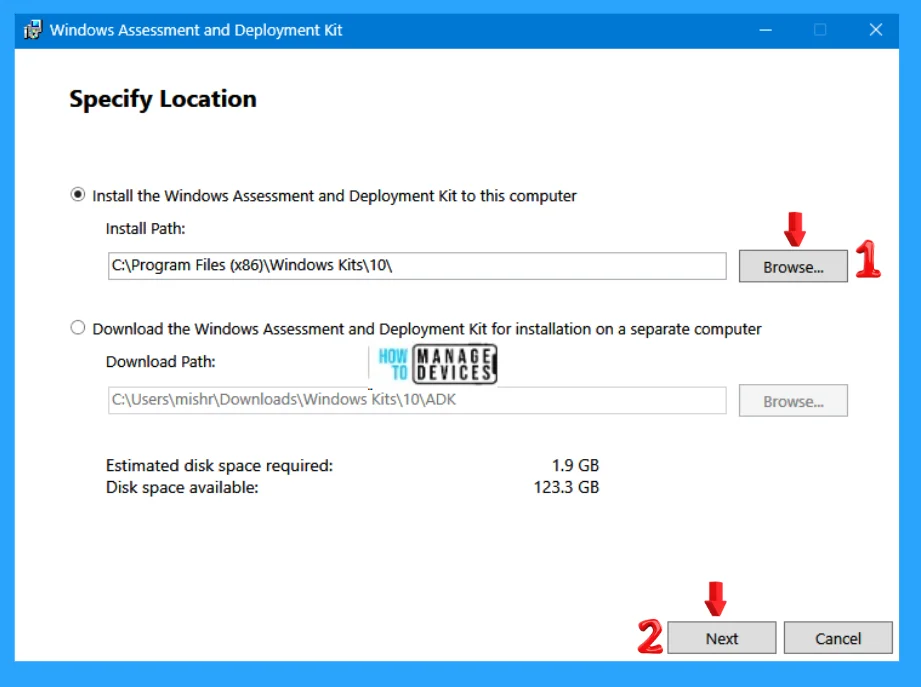
As you can see from the image below, the Windows Assessment and Deployment Kit window appears. From here, you can specify a location for the installation. There are two types of location selection; one is to Install the Windows Assessment and Deployment kit on this computer (here select Install Path), and another is to Download the Windows Assessment and Deployment kit for installation on a separate computer.
Choose an option according to your requirement or choice, and then it is up to you whether to stick to the default path or Browse the desired path. After completing all of the above now click on Next to move to the next Window.
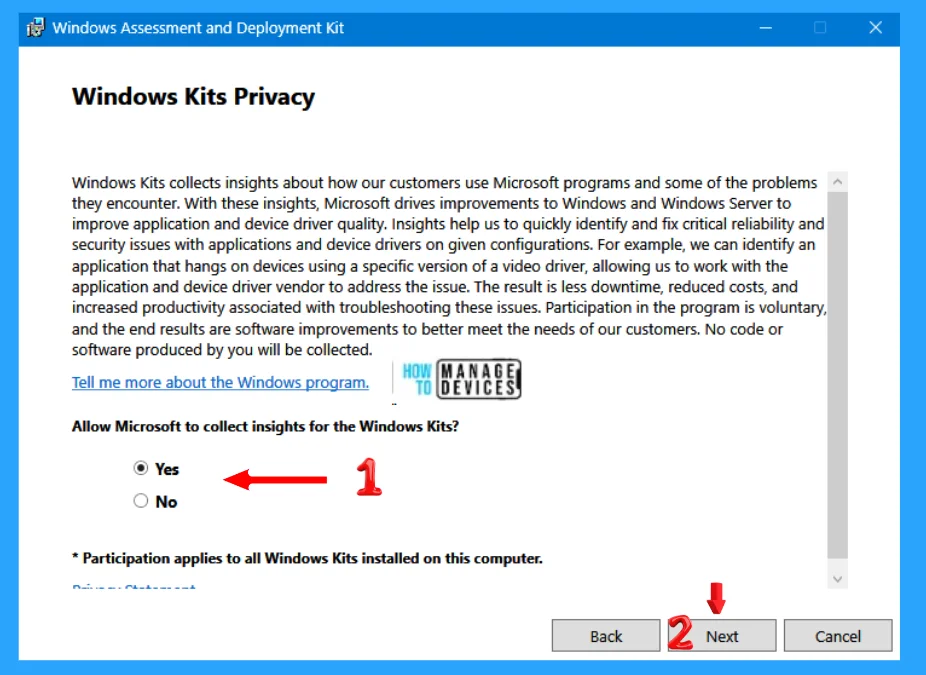
The next is Windows Kits Privacy. This collects insist about the user, who uses Microsoft programs, and some of the problems that the user encounters. With these insights, Microsoft drives improvements to Windows and Windows Server to improve application and device driver quality.
Insights help Microsoft to quickly identify and fix critical reliability and security issues with applications and device drivers on given configurations. For example, Microsoft can identify an application that hangs on devices using a specific version of a video driver, allowing Microsoft to work with the application and device driver vendor to address the issue.
The result is less downtime, reduced costs, and increased productivity associated with troubleshooting these issues. Participation in the program is voluntary, and the results are software improvements to better meet users’ needs. No code or software produced by you will be collected. Click Next to continue.
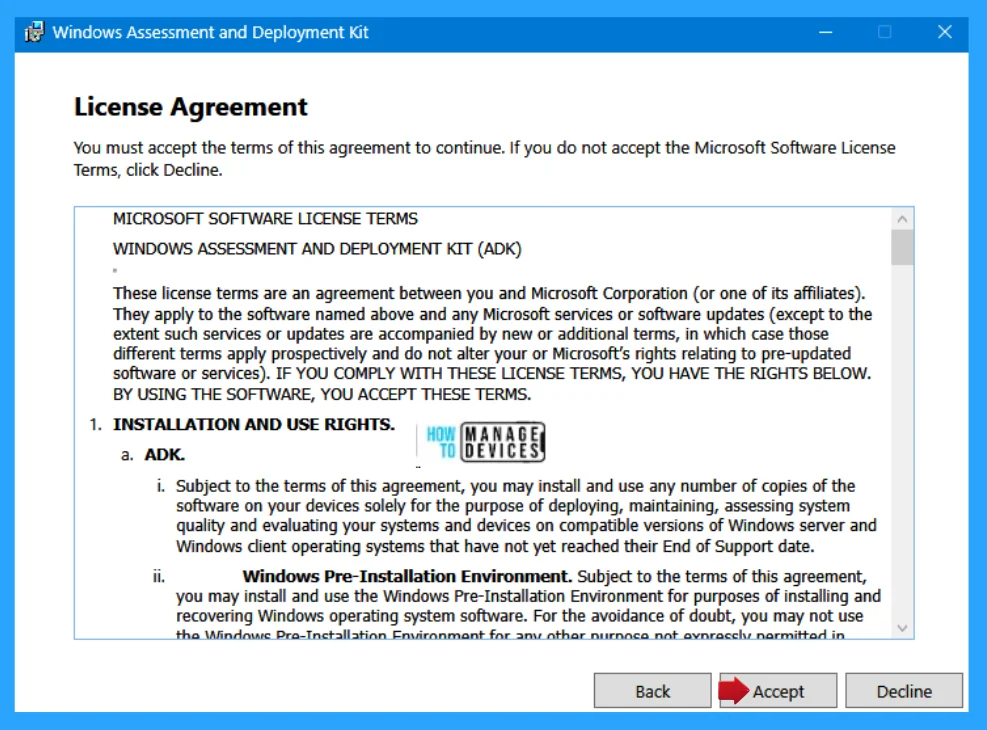
The next Window is the License Agreement. To continue, you must accept the terms of this agreement. If you do not accept the Microsoft Software License Terms, click Decline. These license terms are an agreement between the user and Microsoft Corporation (or one of its affiliates). Click Accept to continue.
The next window allows you to Select the features you want to install. Here, you can click a feature name for more information. You can also add or remove features by checking or unchecking the boxes near all the features. If you select all available features, the file size is almost 4.0 GB. The features are described below.
Note! Select (check) Windows Performance Toolkit to install, and click on Install.
| Features | Description |
|---|---|
| Application Compatibility Tools | Size 8.8 MB on disk. Tools to help mitigate application compatibility issues include: Compatibility Administrator & Standard User Analyzer (SUA) |
| Deployment Tools | Size 123.4 MB on disk. Tools to customize and manage Windows images and to automate installation include: Deployment Image Servicing and Management (DISM) tool, To use DISM cmdlets, PowerShell 3.0 must also be installed, OEM Activation 2.5 and 3.0 Tools, Windows System Image Manager (SIM), OSCDIMG, BCDBoot, DISMAPI, WIMGAPI, and other tools and interfaces. |
| Imaging And Configuration Designer (ICD) | Size 141.0 MB on disk. Tool to streamline image customizations, deployment, and provisioning across all Windows devices. 141.0 MB Requires the following features: User State Migration Tool (USMT) & Configuration Designer |
| Configuration Designer | Size 47.2 MB on disk. Tool to streamline deployments by enabling customizations to be applied in bulk to existing images. For Schools and Small Enterprises, this can be installed stand-alone without the other imaging components. |
| User State Migration Tool (USMT) | Size 536.0 MB on disk. Tools to migrate user data from a previous installation of Windows to a new installation include: ScanState tool, LoadState tool & USMTUtils tool |
| Volume Activation Management Tool (VAMT) | Size 16.1 MB on disk. Tools to automate and manage activation of Windows, Windows Server, and Office. To use VAMT cmdlets, PowerShell 3.0 must also be installed. VAMT requires a connection to SQL Server, version 2008 or later (including Express edition). |
| Windows Performance Toolkit | Size 764.0 MB on disk. Tools to record system events by using Event Tracing for Windows, and a tool to analyze performance data in a graphical user interface, include: Windows Performance Recorder, Windows Performance Analyzer, & Xperf |
| Windows Assessment Toolkit | Size 2.1 GB on disk. Tools to discover and run assessments on a single computer. Assessments are tasks that simulate user activity and examine the state of the computer. Assessments produce metrics for various aspects of the system and provide recommendations for making improvements including: Windows Assessment Console & Assessments Requires the following features: Windows Performance Toolkit |
| Microsoft User Experience Virtualization (UE-V) Template | Size 10.8 MB on disk. Microsoft User Experience Virtualization (UE-V) Template Generator To synchronize application settings between user computers, Microsoft User Experience Virtualization (UE-V) uses settings location templates. Some settings location templates are included in User Experience Virtualization. You can also create, edit, or validate custom settings location templates by using the UE-V Generator. The UE-V Generator monitors Windows desktop applications to discover and capture the locations where the application stores its settings. The application that is monitored must be a desktop application. |
| Microsoft Application Virtualization (App-V) Sequencer | Size 86.8 MB on disk. Microsoft Application Virtualization (App-V) Sequencer. The Application Virtualization (App-V) Sequencer is a wizard-based tool that you use to transform traditional applications into virtual applications. The App-V Sequencer monitors the installation and setup process for an application, and it records the information necessary for the application to run in a virtual environment. You can also use the App-V Sequencer to configure custom changes to the default behavior of the package.86.8 MB |
| Microsoft Application Virtualization (App-V) Auto Sequencer | Size 988 KB on disk. Microsoft Application Virtualization (App-V) Auto Sequencer. The Application Virtualization (App-V) Auto Sequencer is a helper tool for batch sequencing packages. |
| Media eXperience Analyzer | Size 56.1 MB on disk. Tools to analyze media performance data in a graphical user interface include: Auto eXperience Analyzer & Media eXperience Analyzer |
| Supply Chain Trust Tools | Size 195.6 MB on disk. Tools for creating SBOMs and managing supply chain trust include: SBOM Tool & CoseSign Tool |
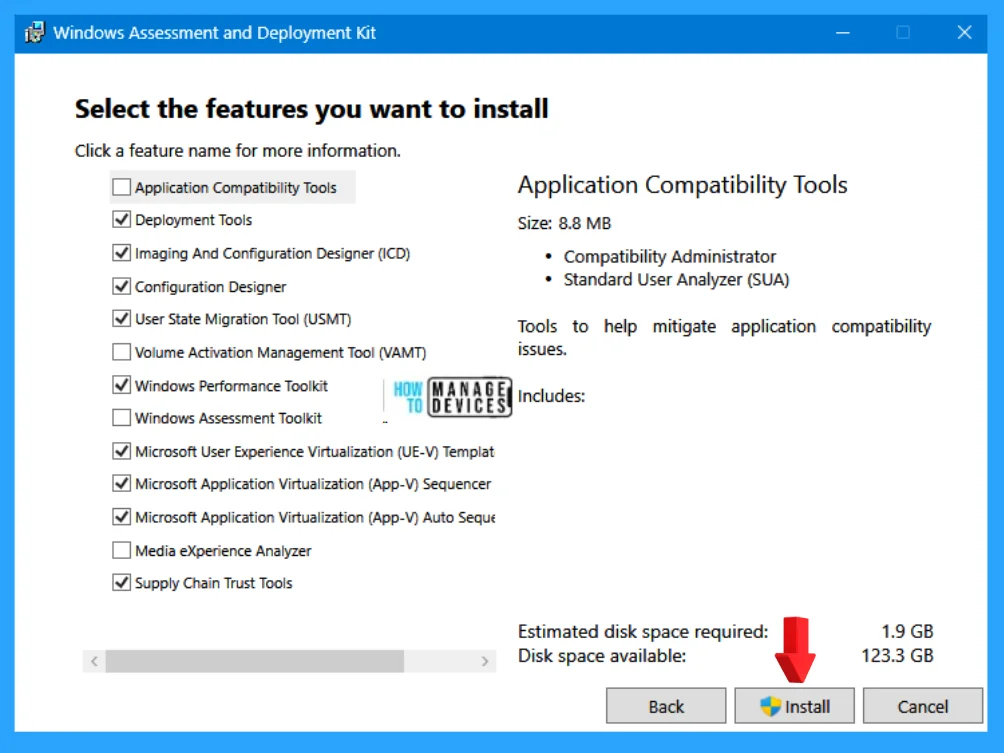
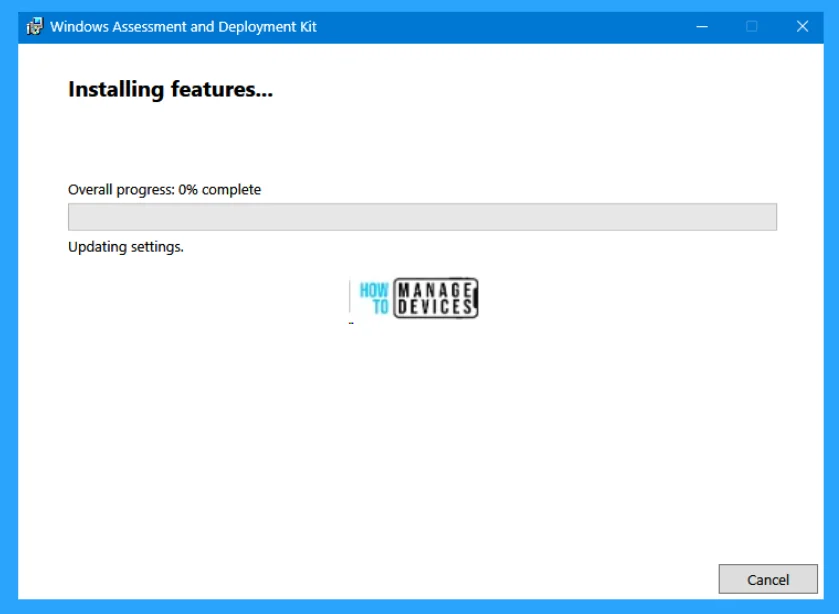
When you click on Install then the installation starts, as shown in the image below, the features of the Windows Assessment and Deployment Kit start to install. It will take more time than usual time to finish the installation.
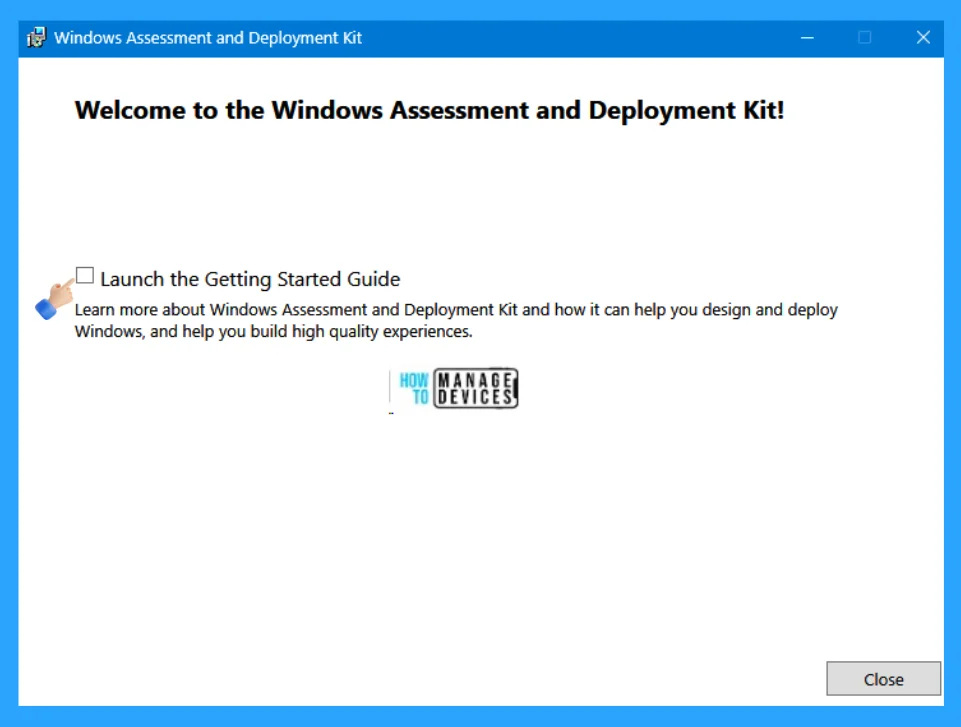
When the installation is completed then the welcome window appears. Welcome to the Windows Assessment and Deployment kit. Now check or uncheck the Launch the Getting Started Guide box. Learn more about Windows Assessment and Deployment Kit and how it can help you design and deploy Windows, and help you build high-quality experiences. Now, tap on Close.
How to Use Windows Performance Recorder
After the installation is completed, type Windows Performance Recorder in the search box on the taskbar. Then click on the appropriate option, as shown in the image below.
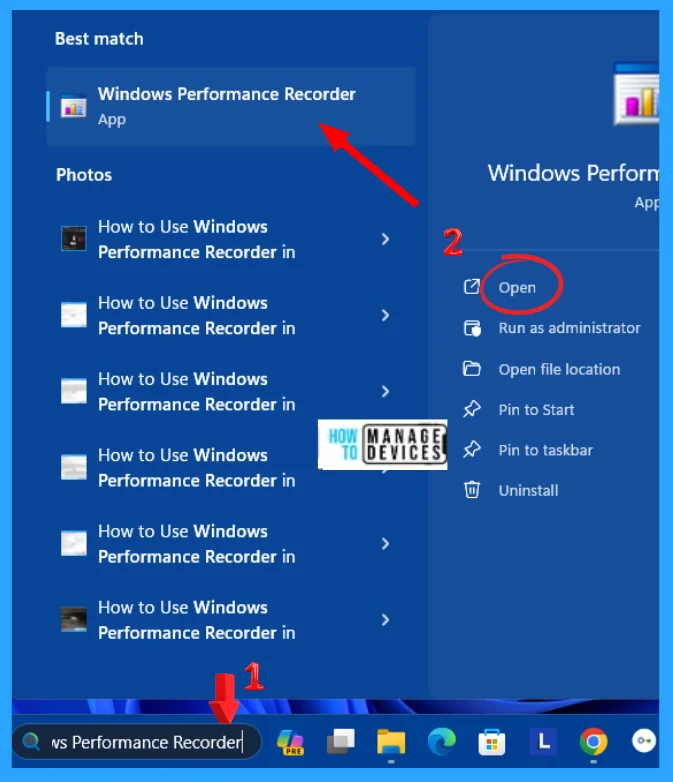
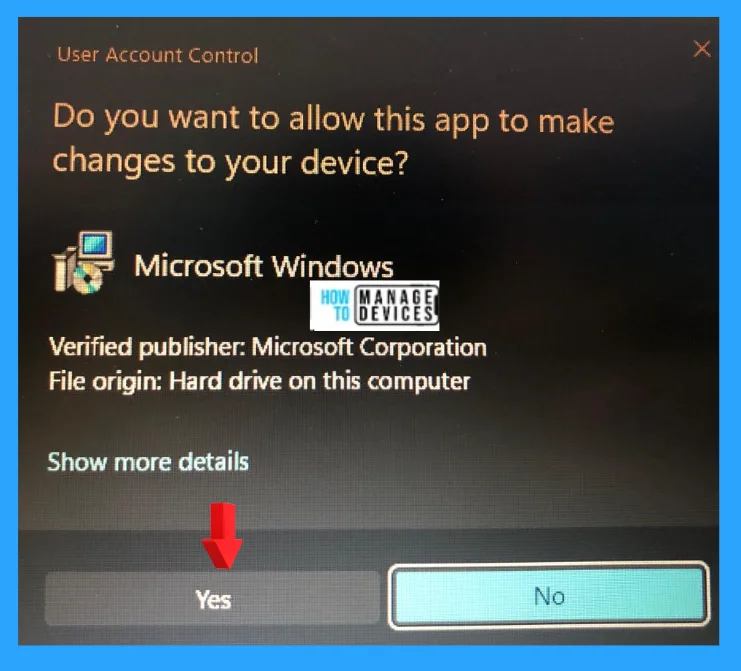
When you click on the required option, the User Account Control window opens and asks Do you want to allow this app to make changes to your device? Click on Yes to continue.
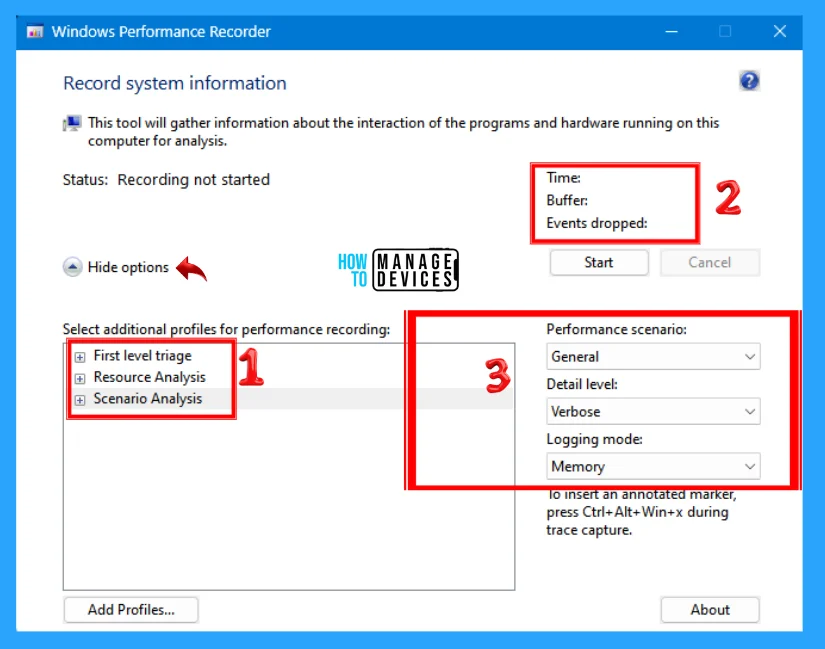
The Windows Performance Recorder window opens, the Record system information, this tool will gather information about the interaction of the programs and hardware running on this computer for analysis.
When you click on More options now, it shows as Hide options. There are additional profiles for performance recording in the number 1.
Windows Performance Recorder (WPR) includes built-in profiles that allow you to specify the recording WPR makes. The More Options menu in the WPR user interface (UI) provides access to these profiles.
Resource Analysis Profiles
The following table describes the built-in profiles that record resource analysis.
| Profile name | Recording |
|---|---|
| CPU usage | CPU utilization for each CPU on the system |
| Disk I/O activity | All disk I/O activity |
| File I/O activity | All file I/O activity |
| Registry I/O activity | All changes to the registry |
| Networking I/O activity | All networking I/O activity |
| Heap usage | All allocations and de-allocations from the heap for the specified process |
| Pool usage | Pool allocations and de-allocations |
| VirtualAlloc usage | All virtual allocations |
| Power usage | Power utilization and idle and sleep states |
| GPU activity | Graphics Processing Unit (GPU)-specific events, such as GPU utilization |
| Handle usage | Usage of handles |
| XAML activity | Events from XAML-related providers |
| HTML activity | Events from HTML-related providers, such as Internet Explorer and JavaScript |
| Desktop composition activity | All desktop composition activity |
| Resident Set analysis | All changes to the resident set |
Scenario Analysis Profiles
The following table describes the built-in profiles that record specific scenarios.
| Profile | Recording |
|---|---|
| Audio glitches | All glitches that occur during streaming audio |
| Video glitches | All glitches that occur during streaming video |
| Internet Explorer | Windows Internet Explorer performance |
| Minifilter I/O activity | Minifilter I/O activity |
| XAML application analysis | XAML app-related activity |
| HTML application analysis | HTML app-related activity |
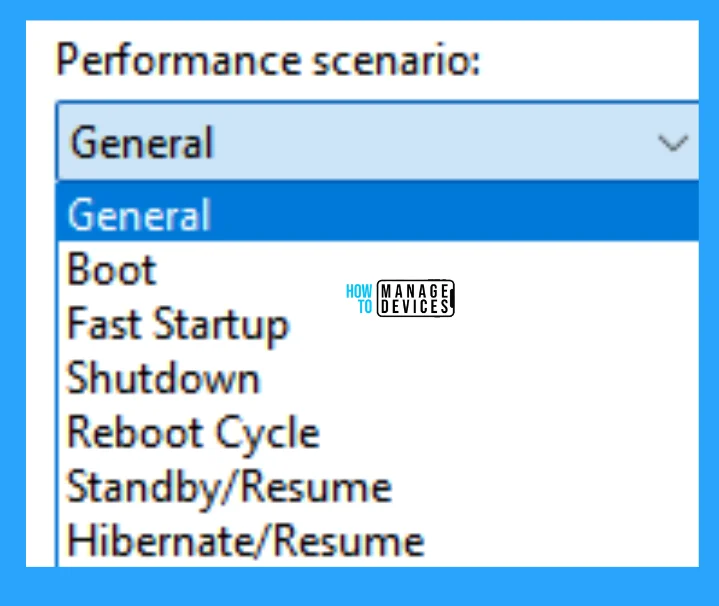
You can select various performance scenarios in the Windows Performance Recorder (WPR) user interface (UI). The following options are available:
- General: Records general performance while the computer is running.
- On/Off – Boot: Records performance while the computer is booting.
- On/Off – Fast Startup: Records performance during a fast startup.
- On/Off – Shutdown: Records performance while shutting the computer down.
- On/Off – RebootCycle: Records performance during the entire cycle while the computer is rebooting.
- On/Off – Standby/Resume: Records performance when the computer is placed on standby and then resumed.
- On/Off – Hibernate/Resume: Records performance when the computer is placed in hibernation and resumed.
NOTE! The on/off transition scenarios can only be logged into the file. They cannot be logged into memory.
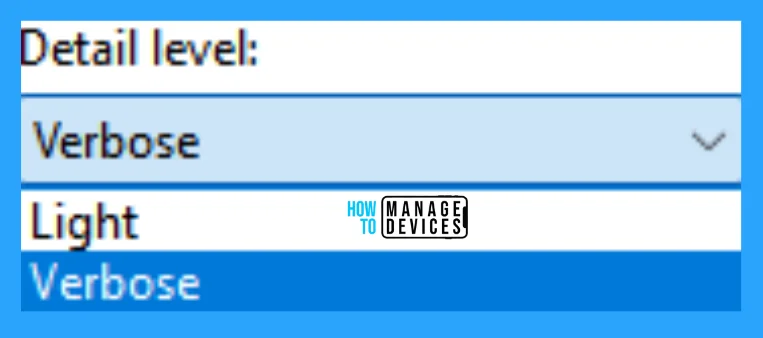
Windows Performance Recorder (WPR) recording profiles control all aspects of a recording. For each WPR profile, you must select a detail level. The available levels are Light and Verbose. The Light detail level is primarily used for timing recordings, while the Verbose detail level provides the detailed information you need for analysis. Built-in profiles support both Verbose and Light detail levels.
The Verbose level is selected by default in both the WPR user interface (UI) and in the WPR command line. When you author custom profiles, we recommend that you define both a light version and a verbose version in the same .wprp file. These files can contain up to four profile definitions: one for each combination of detail level and logging mode.
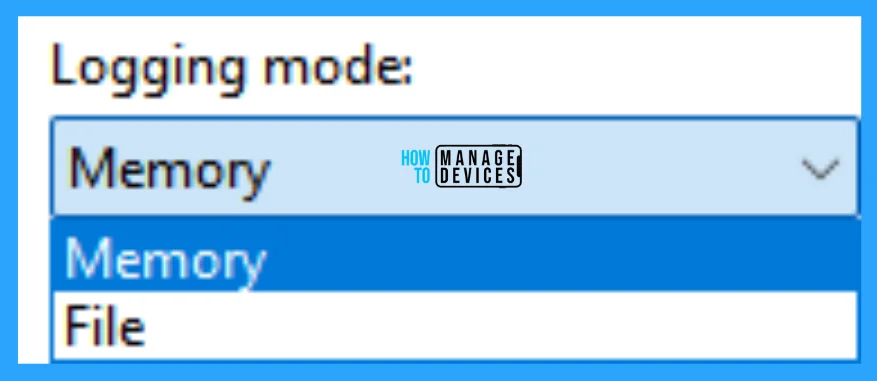
When you define a Windows Performance Recorder (WPR) profile, you must select a logging mode from the following options:
- File: records logging data to a sequential file
- Memory: records logging data to circular buffers in memory
The logging mode is set to Memory by default. However, On/off transitions are always logged to a file.
Logging to file is typically used for short recordings for which you can anticipate the events that will be recorded. Logging to memory is typically used to log events that can occur at any time. When WPR logs to memory, buffer size and the level of profile detail determine how long WPR can log data before old events are overwritten.
NOTE! To limit file size, choose Memory. When logging into a file, available disk space is the only limitation to file size. If the file is too large, you might not be able to analyze it in Windows Performance Analyzer (WPA).
Buffer Size
Buffer size is important for controlling I/O efficiency and ensuring that WPR does not skip large events. Very small buffers can reduce I/O write efficiency. We recommend a minimum buffer size of 64 KB or 128 KB to promote good write performance and reduce disk overhead and lost events. Buffer size determines the maximum duration of a recording. ETW limits the largest event size to approximately 64 KB.
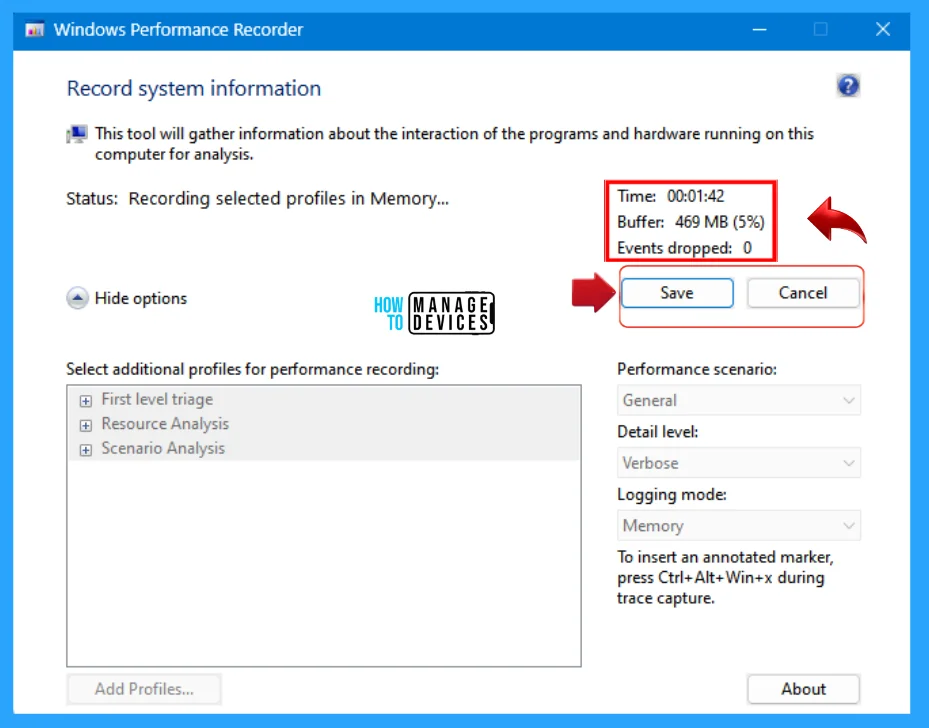
Click on the Start button, and the Windows Performance Recorder starts. The start button turns to the Save button. The start and stop recorder are explained below.
- On the Start screen, click Windows Performance Recorder.
- To run the default profile, click Start.
- Click Start to begin recording, or click Cancel to end without recording.
- On the WPR screen, click Save. If you click Cancel, no data is saved.
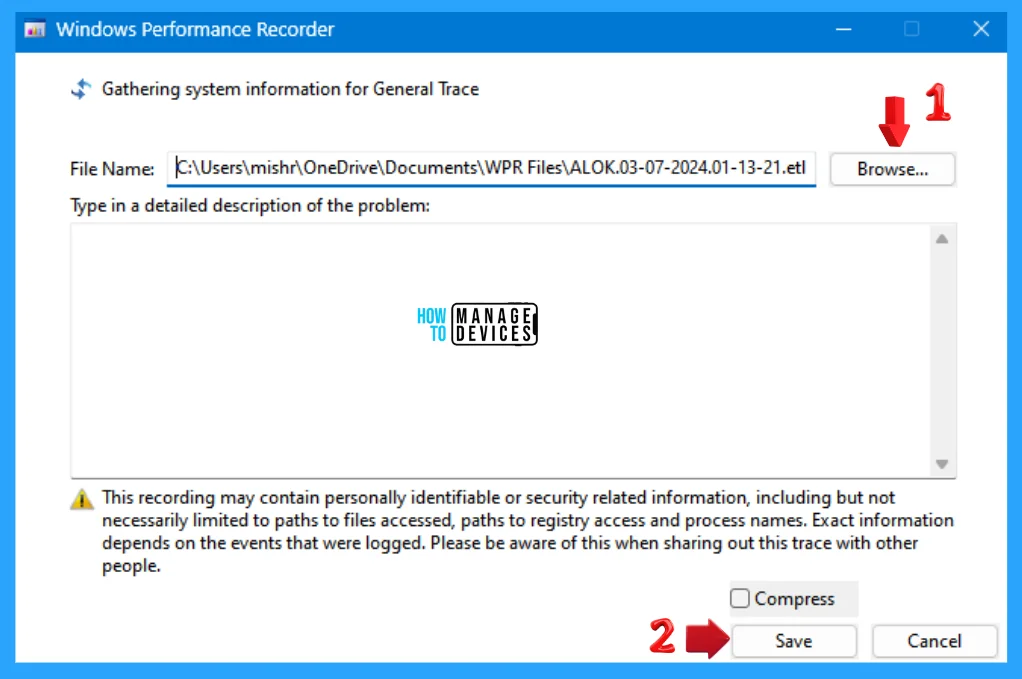
- Browse to the location to which you want to save the recording file.
- Enter a description of the problem for which you created the recording.
- Click Save and then click OK.
When you click on the Save button, the system information for General Trace is gathered. You can browse the location to save the Windows Performance Recorder information, or you can use the default setting.
NOTE! This recording may contain personally identifiable or security-related information, including but not necessarily limited to paths to files accessed, paths to registry access, and process names. The exact information depends on the events that were logged. Please be aware of this when sharing this trace with other people.
I hope the guide on How to Use Windows Performance Recorder in Windows 11 is helpful. Please follow us on the HTMD Community and visit our website HTMD Forum, if you like our content. Suggest improvements, if any, and we would love to know which topic you want us to explore next.
We are on WhatsApp. To get the latest step-by-step guides and news updates, Join our Channel. Click here –HTMD WhatsApp.
Author
Alok is a Master of Computer Applications (MCA) graduate. He loves writing on Windows 11 and related technologies. He likes to share his knowledge, quick tips, and tricks with Windows 11 or Windows 10 with the community.
